

1. Alerting for echelons
Are echelons likely to occur during the race and what are the critical sections?
2. Head- and tailwinds
How strong the head- and tailwinds will be during the race?
Features
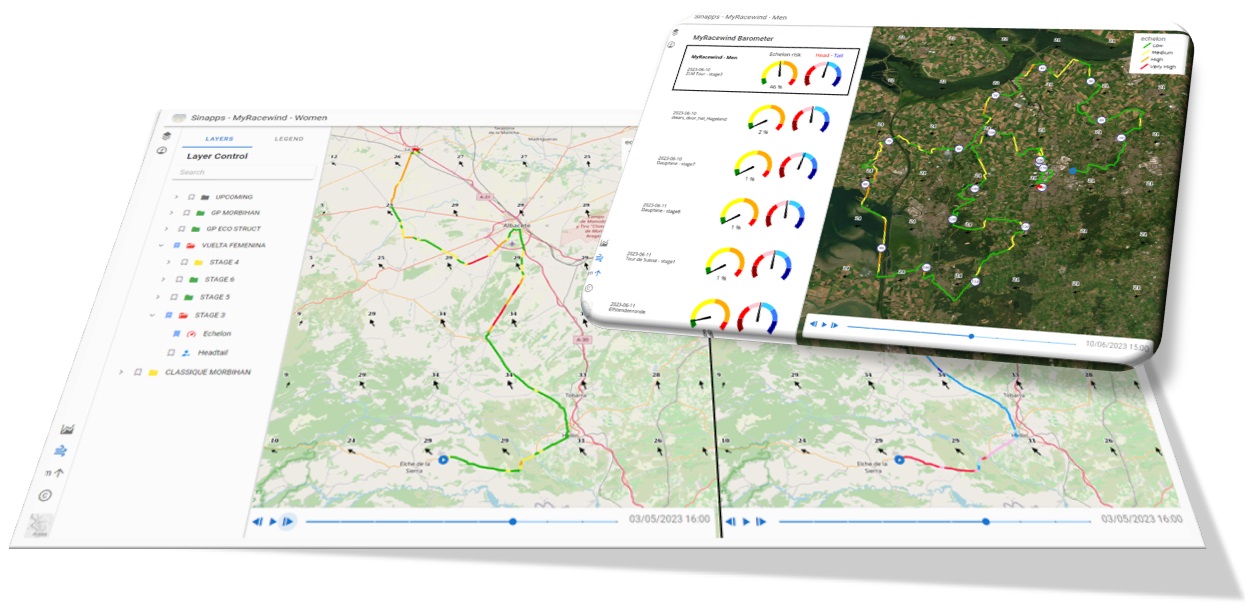
MyRacewind is a web app that runs on multiple devices and multiple platforms (iOS, Android). The interface is built around a map view where you can select a race. Each race contains following two layers:
echelon risk map
head-tailwind map
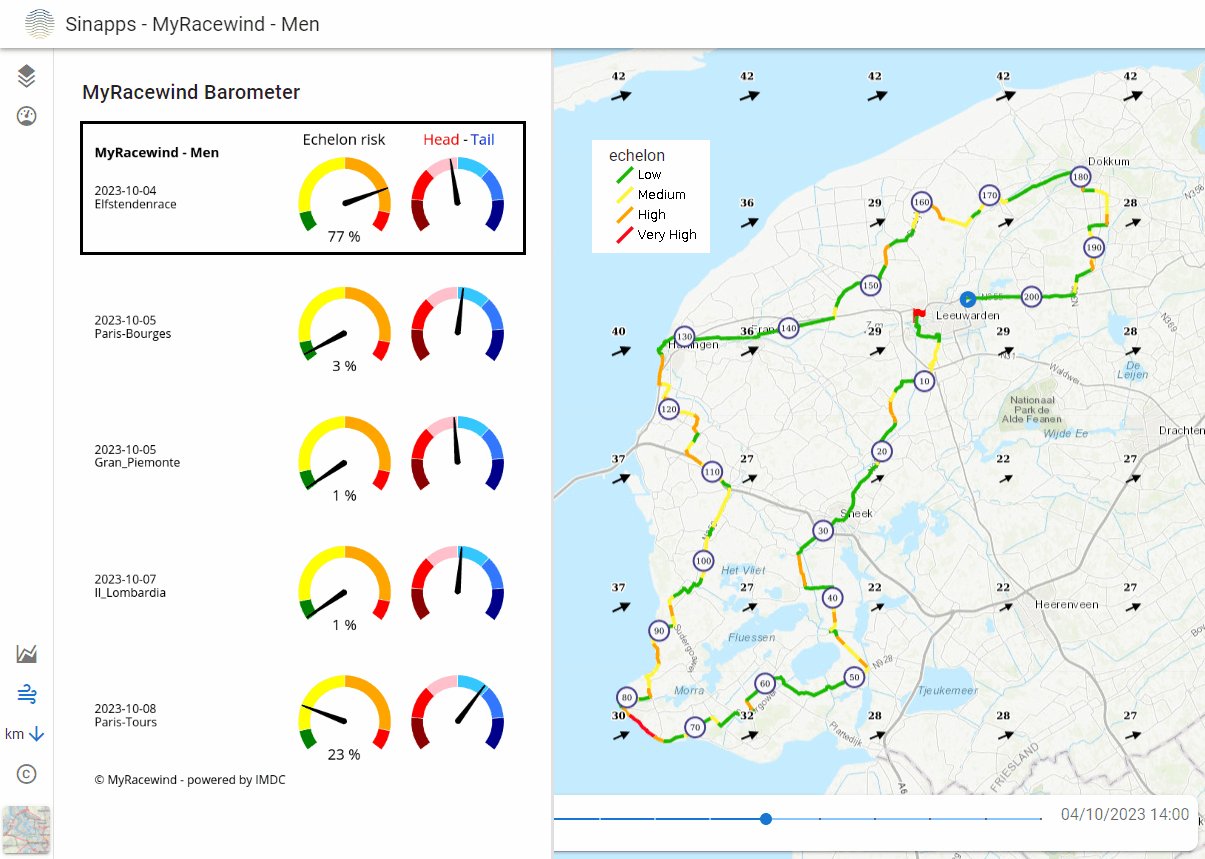
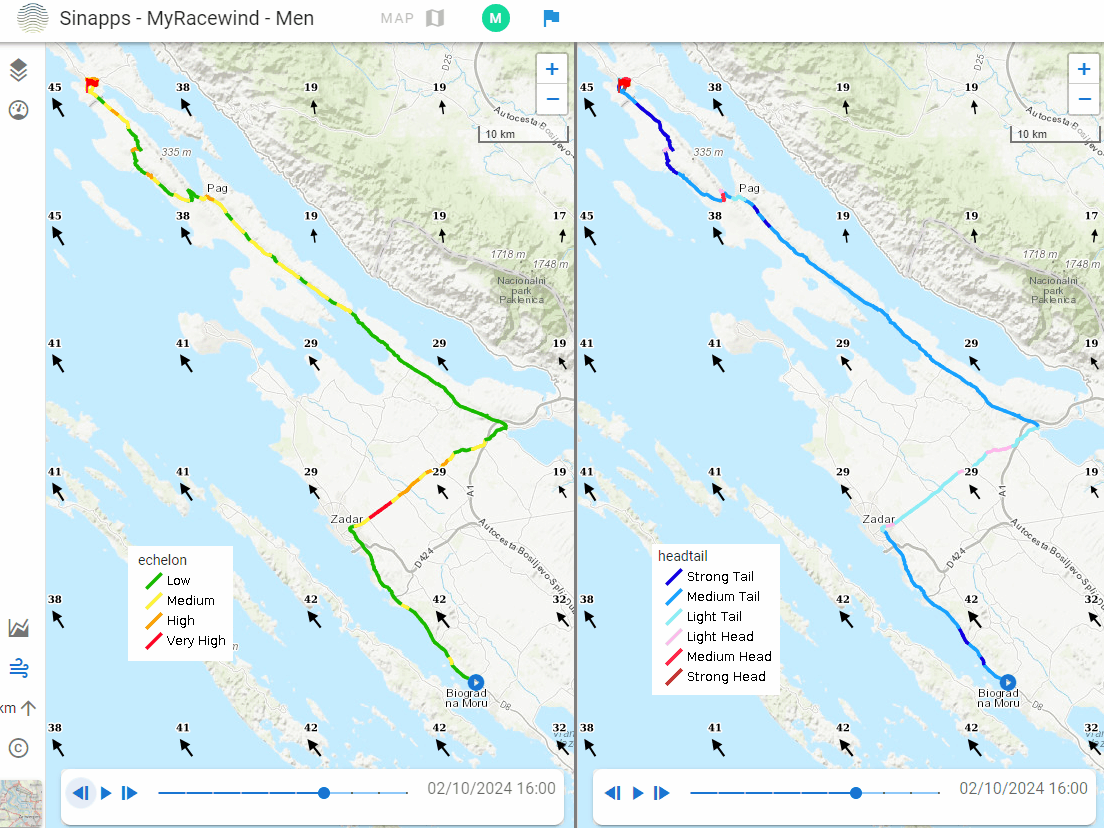
The echelon risk map shows the risk for echelons by making use of alerting colors: green, yellow, orange and red. Green means “very low” risk and red “very high”.
The app only requires a GPX race track as input and is based on an algorithm, that includes four parameters:
The head-tailwind map shows red colors for headwinds and blue colors for tailwinds. The darker the color the more head- or tailwind.
MyRacewind uses real time wind forecasts and can start forecasting two weeks ahead of a race. With a time slider, changes during the race can be followed every hour. There is a geolocation option to position yourself along the track,
which is useful for team directors in the car.
Get in touch
The app supports riders, teams, organizers, media, …
If you are interested, feel free to contact us by filling out the form below.
contact information
Developed by
